


 127 / 232

Annual Report 2017
125
Group
Company
2017
2016
2017
2016
Note
RM’000
RM’000
RM’000
RM’000
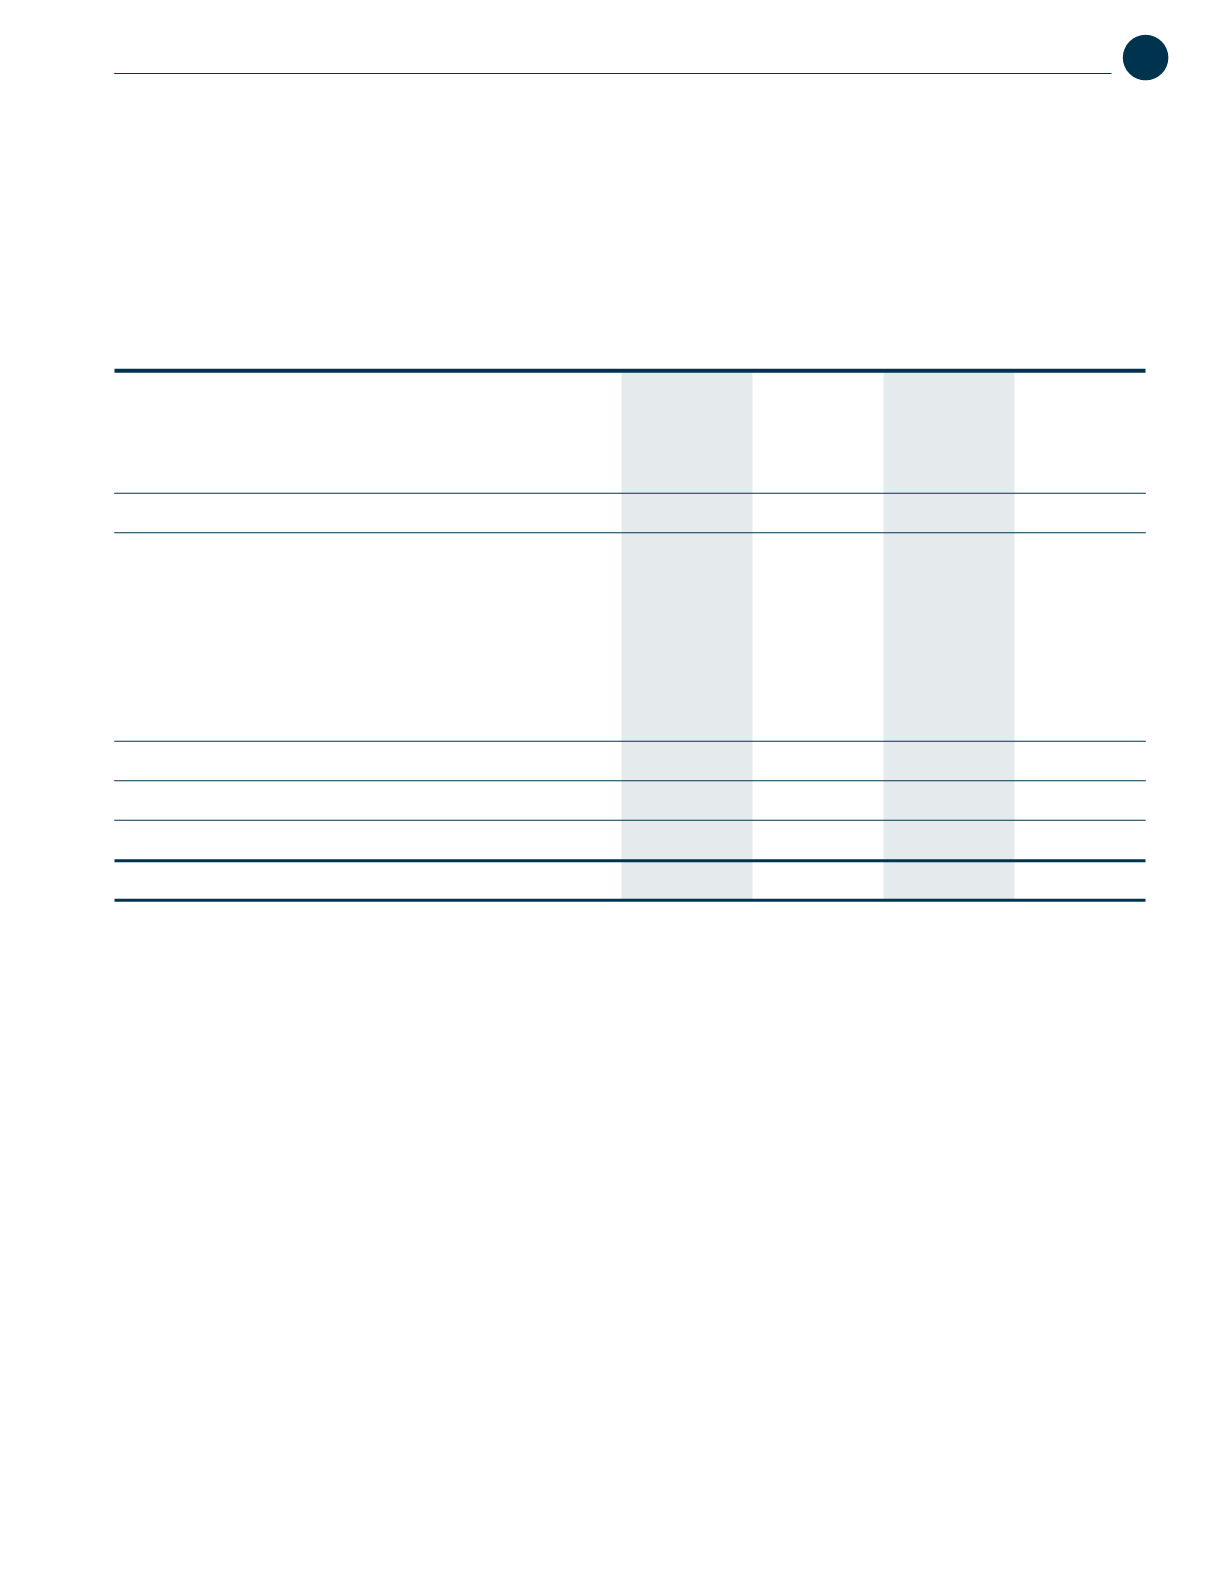
Non-current liabilities
Finance lease obligations
26
16,176
16,799
-
-
Retirement benefit obligations
27
1,837
1,391
-
-
Deferred tax liabilities
28
32,922
46,951
6,279
6,863
50,935
65,141
6,279
6,863
Current liabilities
Finance lease obligations
26
624
646
-
-
Short term borrowings
29
14,516
15,281
14,516
13,020
Trade and other payables
30
112,459
85,388
1,432
1,348
Provisions
31
16,947
19,234
-
-
Due to subsidiaries
22
-
-
17,573
25,344
Tax payable
2,388
686
-
-
146,934
121,235
33,521
39,712
Total liabilities
197,869
186,376
39,800
46,575
Total equity and liabilities
1,224,276
1,185,662
460,098
433,132
Net assets per share (RM)
2.72
2.70
1.49
1.40
Statements of
financial position
as at 31 march 2017
The accompanying accounting policies and explanatory notes form an integral part of the financial statements.