


 29 / 232

Annual Report 2017
27
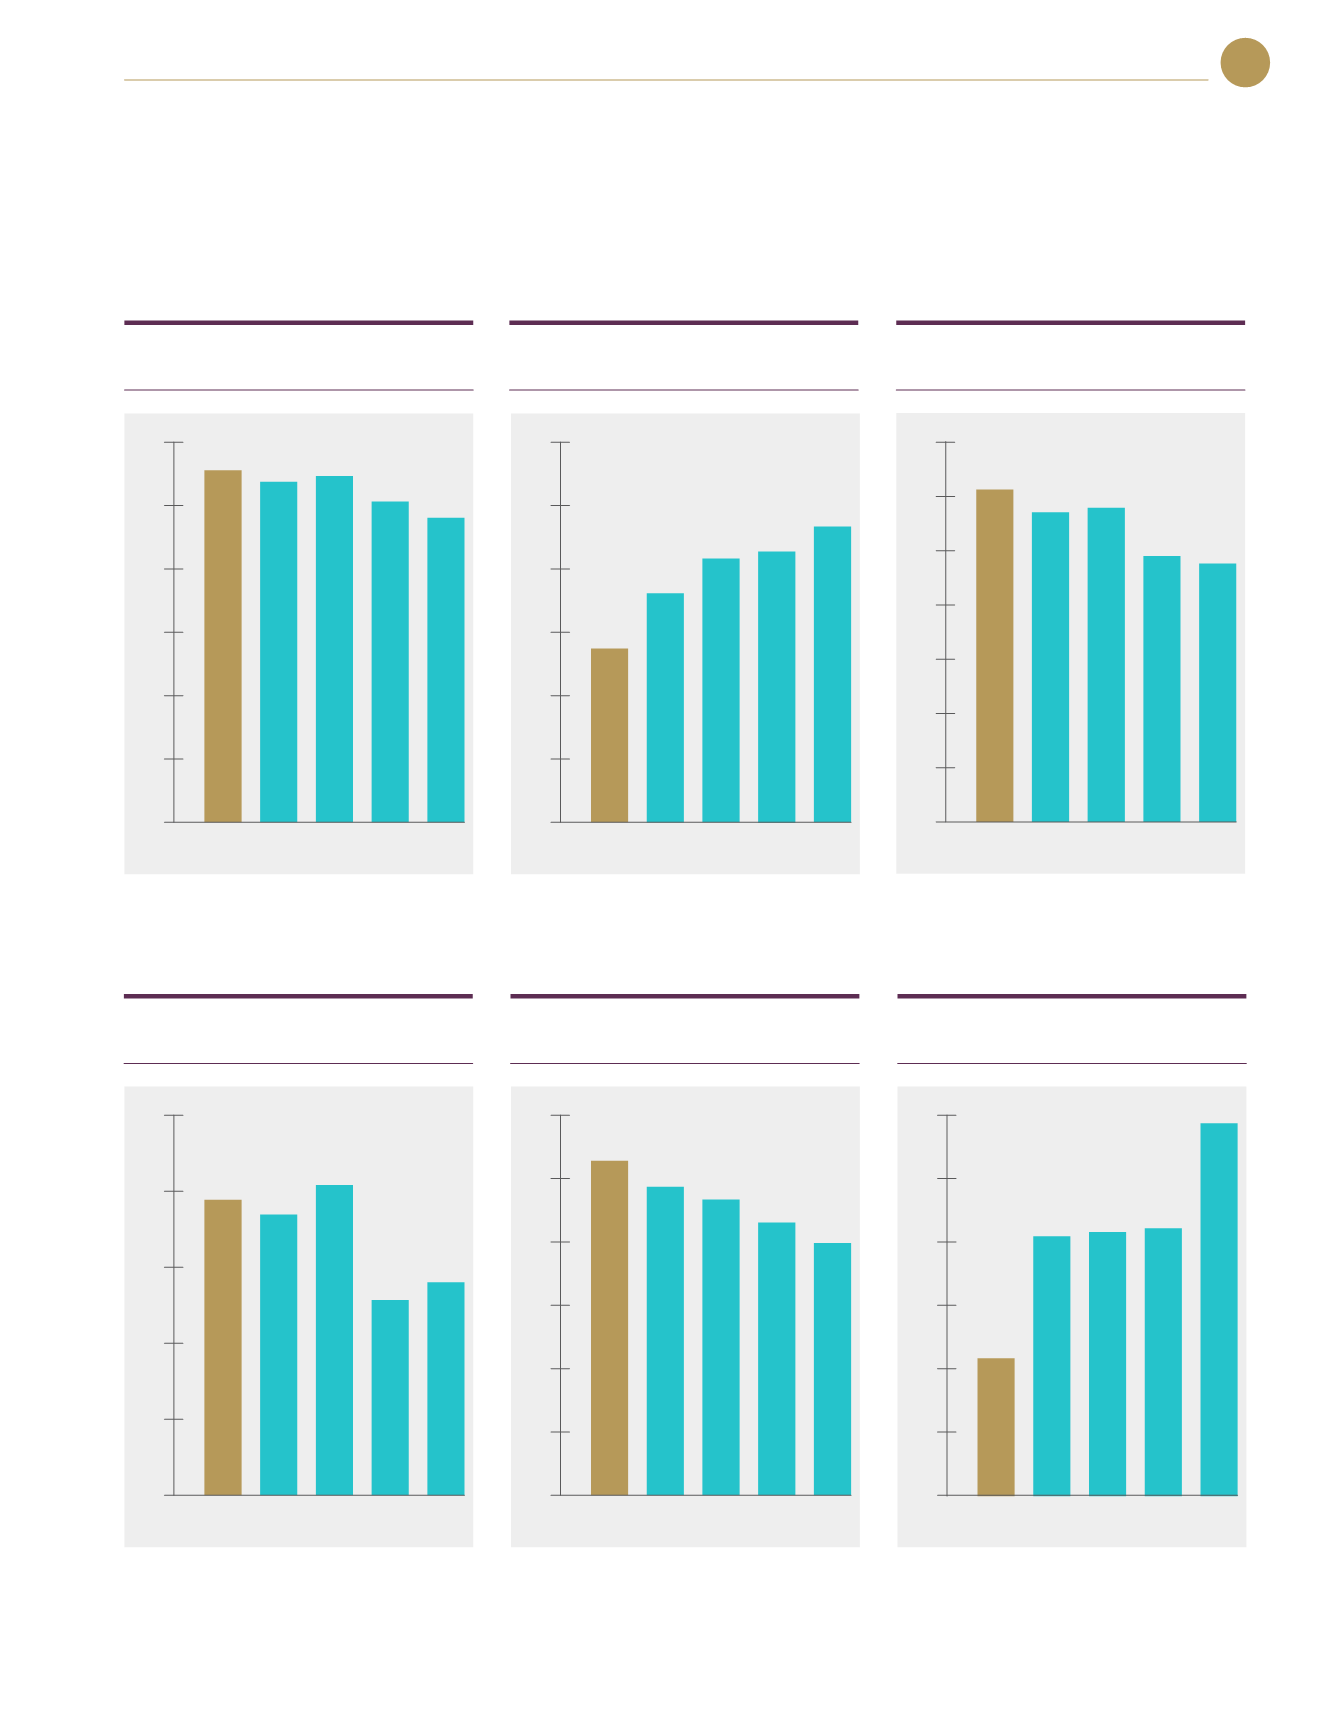
FIVE-YEAR
FINANCIAL HIGHLIGHTS
Revenue
total assets
shareholder’s funds
total liabilities
earnings per share (basic)
(rm ’million)
(rm ’million)
(rm ’million)
(rm ’million)
(rm ’million)
(rm ’sen)
600
180
500
150
400
120
300
90
200
60
100
30
0
0
541.11
547.21
504.59
486.52
544.79
900
250
750
200
600
150
450
100
300
50
150
0
0
1,200
1,400
1,000
800
600
400
200
0
30
25
20
15
10
5
0
111.67
84.67
122.30
129.36
142.02
profit before taxation
1,185.66
1,224.28
1,189.50
991.78
970.64
748.30
186.38
768.70
197.87
732.29
211.49
638.28
128.55
613.30
138.90
20.51
10.70
21.26
22.16
29.05
2017
2016
2013
2015 2014
2017
2016
2013
2015 2014
2017
2016
2013
2015 2014
2017
2016
2013
2015 2014
2017
2016
2013
2015 2014
2017
2016
2013
2015 2014