


 39 / 220

3 5
Kumpulan Fima Berhad (11817-V) •
Annual Report 2018
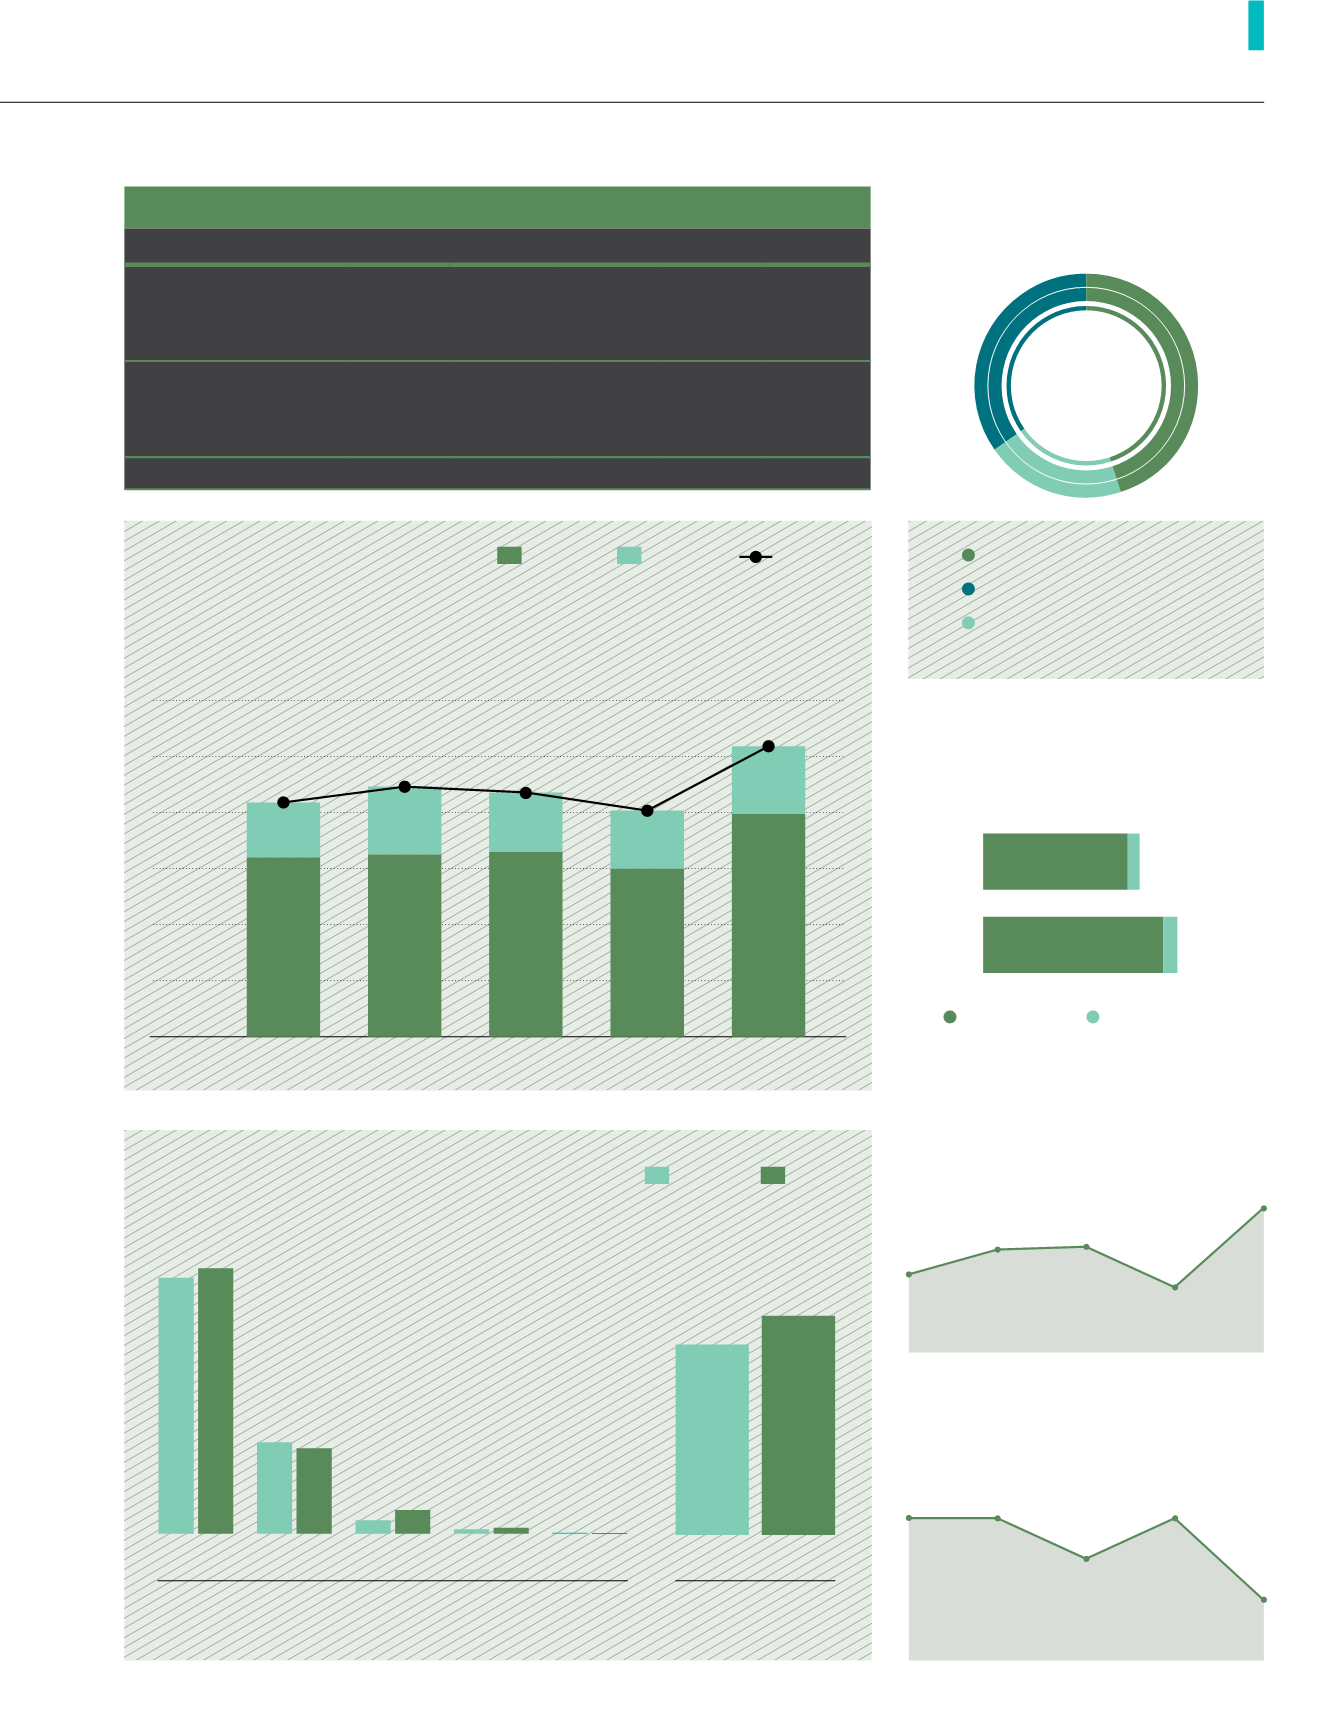
Plantation Division
Palm profile (HA)
Year
FYE2014 FYE2015 FYE2016 FYE2017
FYE2018
> 19 years
881
432
-
-
-
10 - 18 years
5,711
6,154
6,154
6,214
6,206
4 - 9 years
1,439
1,097
1,594
1,502
1,913
8,031
7,683
7,748
7,716
8,119
Rehab
-
-
-
-
566
Immature
2,512
4,678
4,798
5,491
5,447
Total Planted Area
10,543
12,361
12,546
13,207
14,132
MILL Performance
(MT)
41,619
51,887
3,419
4,013
FYE
2017
FYE
2018
CPO Volumes
CPKO Volumes
Planted Area
(Ha)
Indonesia
·············
45.1%
(6,372)
Sarawak
···············
34.6%
(4,889)
Peninsular
Malaysia
···············
20.3%
(2,871)
5-YEAR FFB
BREAKDOWN ANALYSIS
(MT)
FFB
Production
FFB
Purchased
Total FFB
Processed
Pineapple Segment
Moris
31 42
Others
13 0.2
Josa
2,277 2,361
N36
812 760
MD2
116 210
FYE2017 FYE2018
Pineapple Production (MT)
Segment Revenue
(RM ’million)
2.72
3.13
100,000
50,000
150,000
200,000
250,000
300,000
-
FYE2014
49,144
160,793
209,937
FYE2015
60,677
162,526
223,203
FYE2016
53,198
164,738
217,936
FYE2017
51,853
149,753
201,606
FYE2018
60,460
198,644
259,104
Oil extraction rate
(%)
FYE
2014
FYE
2015
FYE
2016
FYE
2017
FYE
2018
22.7
22.7
22.4
22.1
22.7
yield per hectare
(mt)
21.1
19.4
21.3
22.9
20.0
FYE
2014
FYE
2015
FYE
2016
FYE
2017
FYE
2018