


 25 / 204

page
23
KUMPULAN FIMA BERHAD
(11817-V) |
Annual Report
2016
2009
2010
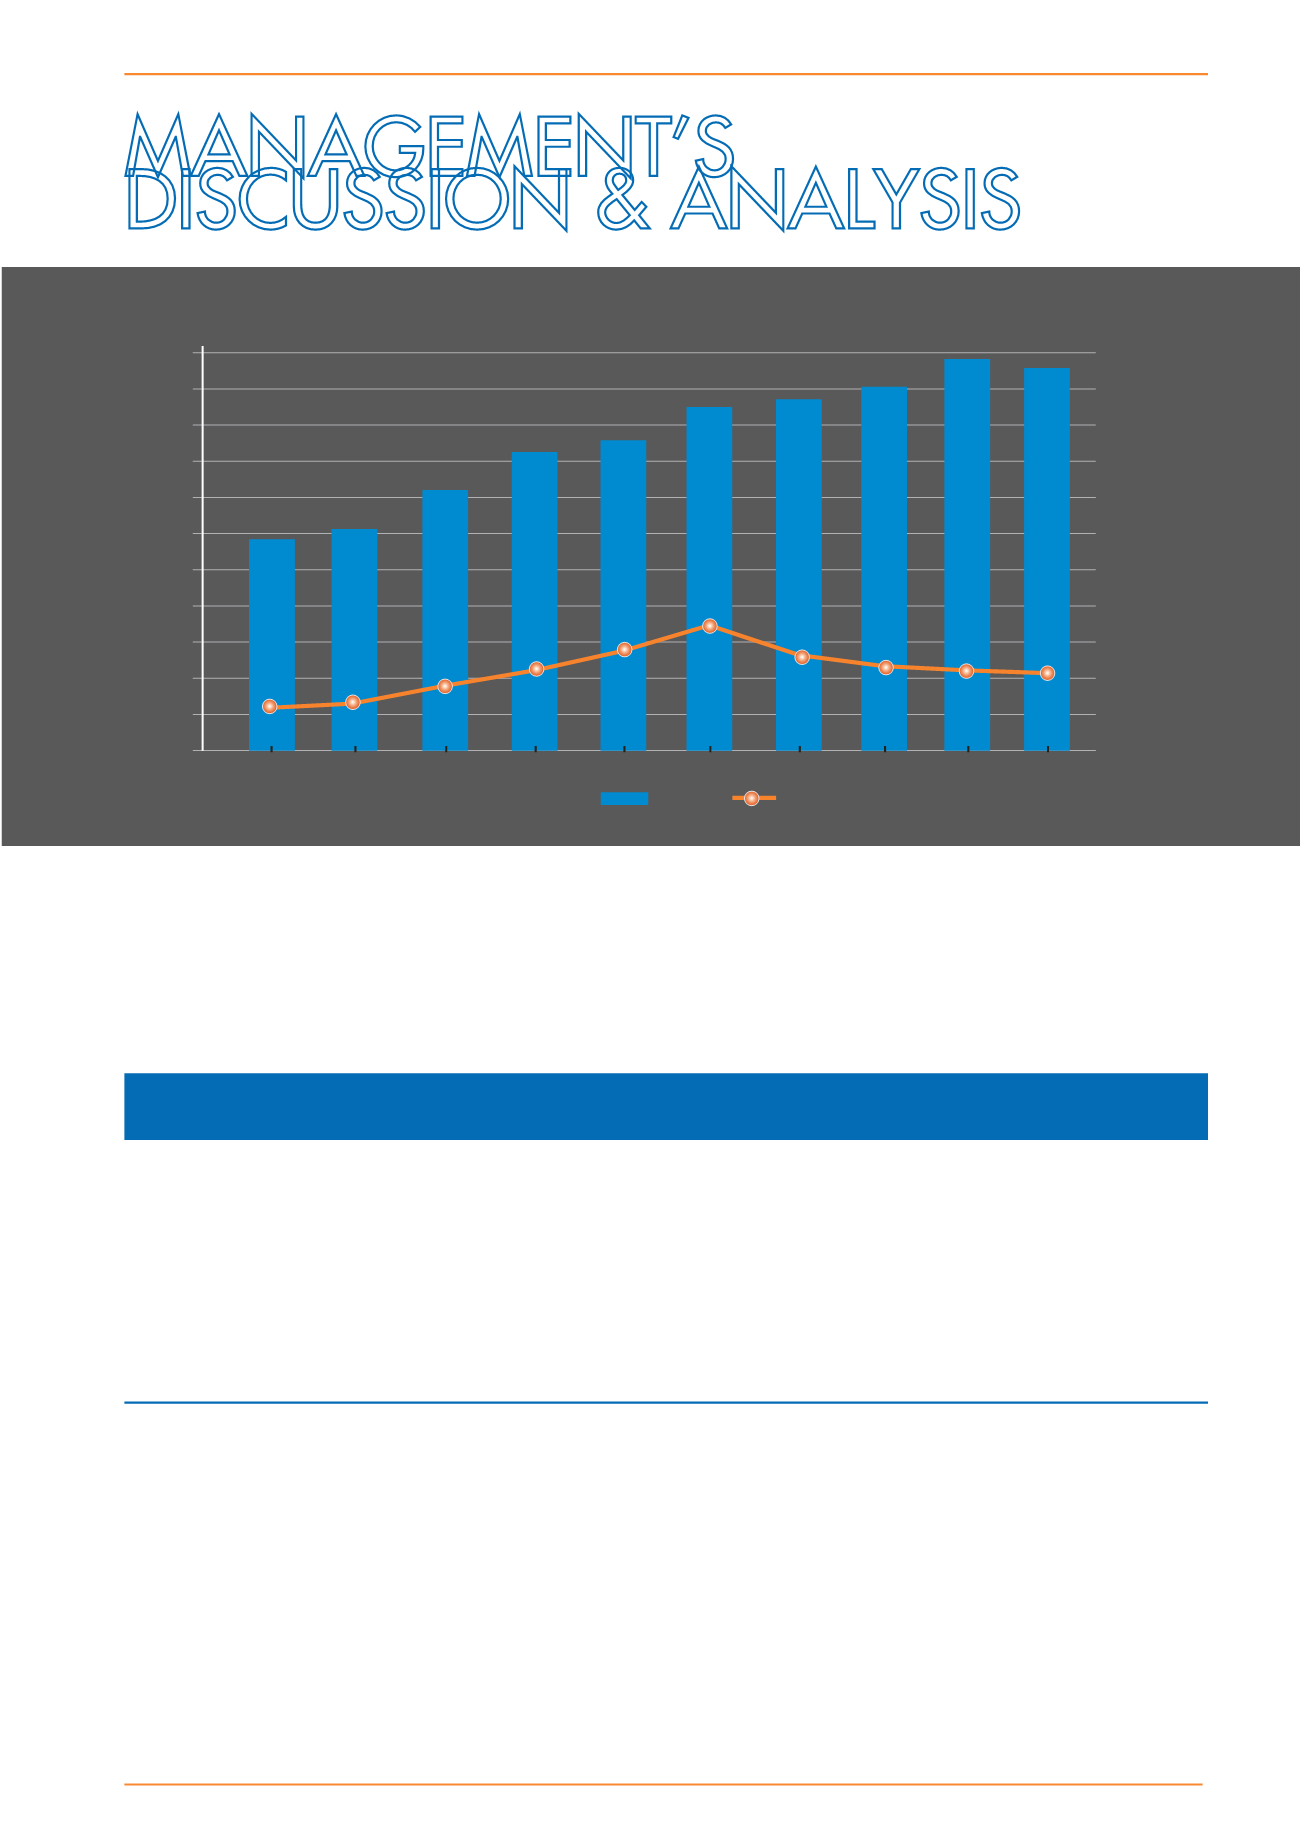
Revenue
PBT
2007
2008
2013
2014
2015
2016
2011
2012
51,389 56,862
81,193
115,726
140,930
153,812
142,016
129,362 122,302 111,674
294,397 308,712
369,070
411,432
431,884
470,753 486,524
504,586
544,789
541,107
0
50
100
150
300
250
200
350
400
500
450
550
RM ‘000
Years
Key Performance Indicators
INTRODUCTION
The Group’s principal activities remain unchanged throughout the financial year. The purpose of this review is
to highlight and provide brief insights on key financial and operating information at Group level. A more detailed
commentary on operating performance is covered under the respective business segment reports.
KEY FINANCIAL INDICATORS
Change
FYE2016 FYE2015
%
Revenue
RM million
541.11
544.79
(0.7)
Earnings Before Interest And Taxation (EBIT)
RM million
112.19
122.65
(8.5)
Profit Before Tax (PBT)
RM million
111.67
122.30
(8.7)
Profit After Tax (PAT)
RM million
80.00
84.02
(4.8)
Return On Average Shareholders’ Equity (ROE)
%
8.1
9.1
(11.3)
Return On Average Capital Employed (ROCE)
%
10.7
12.8
(16.4)
Total returns to shareholders
- Gross dividend (per RM1.00 share)
sen
9.00
8.50
5.9
Net gearing
times
0.19
0.22
13.6
FINANCIAL HIGHLIGHTS AND INSIGHTS
At Group level, the results for FYE2016 versus FYE2015 are best compared and explained at three levels, mainly,
Revenue, PBT and PAT.
Revenue
decreased by approximately RM3.68million or 0.7% fromRM544.79million in the previous corresponding
year against RM541.11 million in FYE2016. The overall decline in revenue was largely attributed to the lower
revenue contributions from Plantation and Food Divisions.
Profit Before Tax
decreased by 8.7% to RM111.67 million from last financial year. The decrease is due to lower
contributions from Plantation Division and associate companies. In addition, higher provision of doubtful debts
and increase in operating costs in the Others segment have also contributed to the decrease in PBT.